
Journey with us as we test out the new Bilby reporting controls on some activities. The goal is to export the data into Google Earth and view activity coverage from our Partner site Canberra Bushwalking Club.
The goal
This article is about testing the reporting controls in Bilby. While building this feature, we wanted to try some real world scenarios to see if they had enough flexibility to perform certain actions. So for this case study, the goal will be to export activity data from a Bilby partner site (with permission of course) and then view the activity data by year, in Google Earth on the desktop version.
Canberra Bushwalking Club has great data spanning from late 2017 that was imported into Bilby Management Software, and started using the system in October 2022, so it will be super interesting to see what the coverage will look like.
Part 1 - Collecting the data from Bilby
First thing is first, we need to export some data. This article will dive straight into the deep end, but if you would like to know some more of the granular details, jump into the Bilby Management Software Wiki for step by step guides.
So, to collect the data needed to display on something like Google Earth, we need the map start marker data. We will also grab a couple of other things from our activities to make identification easier.
Here are the fields we are going to collect.
Map Start Marker - The map start marker contains latitude and longitude information. We will use this in Google Earth to place the marker.
Title - The activity title is more or less just a label in this instance.
Start Date - The start date will be used split our records into years so we can inspect what the activities looked like year to year.
Status - We only want activities marked as completed in this report, so we will add that filter when reporting.
1.1 Adding the report columns
We know what columns we are interested in, so firstly we select the “Columns” option. We can remove the default columns using the “Remove” button on each row.
We can also select columns that we want to appear in this report. We will select the “map start marker” column and for this report, we’ll move it to the first position.
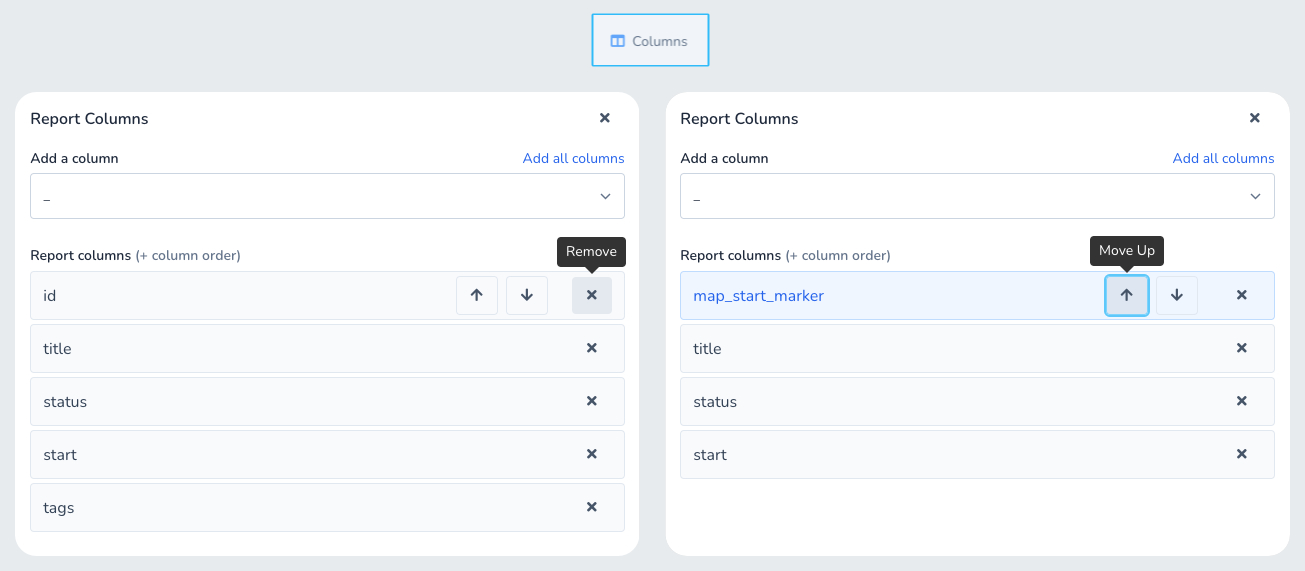
Removing columns and changing column order using the buttons provided.
Once we have our selected columns, we can click the “Update” button to make sure the changes are applied.
1.2 Update the sorting and page size
Personally when I am performing reporting and gaining insights, if I’m looking for specific records I will choose smaller page sizes to bring back data quickly and make scanning records easy. When I am not sure what I am looking for, then I will usually try to bring back more records.
For this example we will select the middle option of 50 records per page. We are interested in sorting the data by the year, so we will order by start date in and ascending order (A - Z) which will give us early dates first. This will make it easy to split the data into pages later.
We can now click on the “Add Sort” button to apply the sorting for this report.
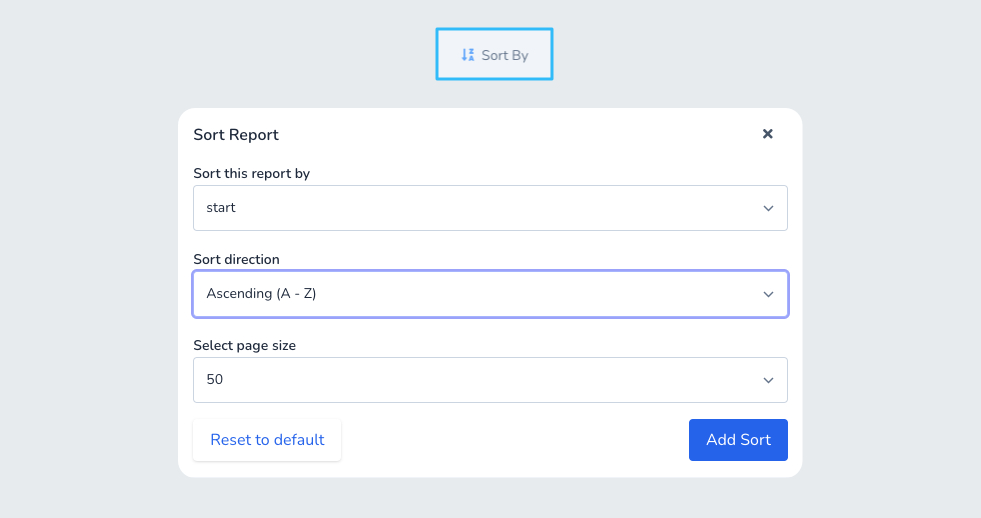
The selected sorting options for this report.
1.3 Adding filtering to the report
So, we have a good looking list of data with the correct columns and sorting applied, but we can see several Draft activities, or Cancelled or Removed. The first thing we want to add is a filter to only show “Completed” activities.
To do this we can simply click on the “Add Filter” button, and select the “status” field. We can see the middle compare option has been locked to “Is Equal To”, so we can ignore that for now and select the “status” we want to include in our report.
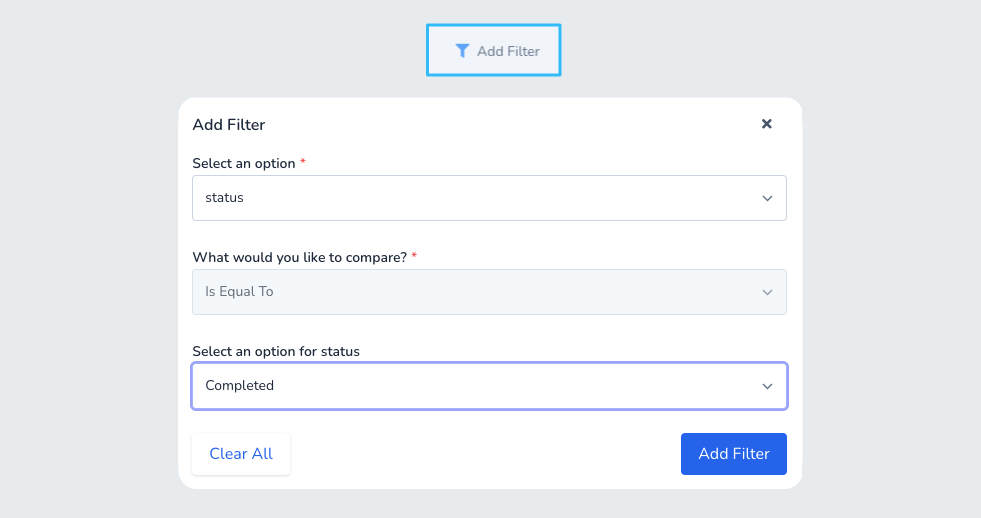
Selecting the status filter.
Info
Ok, so now we can see Completed activities only, but we have another problem. We can see activities without a start marker which will not offer much value when importing into Google Earth.
To filter activities without marker data, we can apply a little bit of a trick. We know that map start makers are a comma delimited string with latitude and longitude, so we will add a filter to partially match a comma that will bring back records only records with map data.
Message
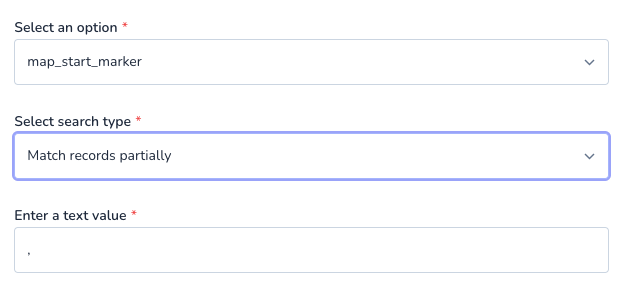
Selecting the map start marker filter.
At this stage we could apply more filters such as “Start” to get results for each of the years that we are interested in, or anything else that we can think of. Lets apply the current filters by clicking the “Add Filter” button and we can move onto exporting the data.
1.4 Exporting the records
Ah great, we now have a good looking report with exactly the data we are looking for. Now time to export the records.
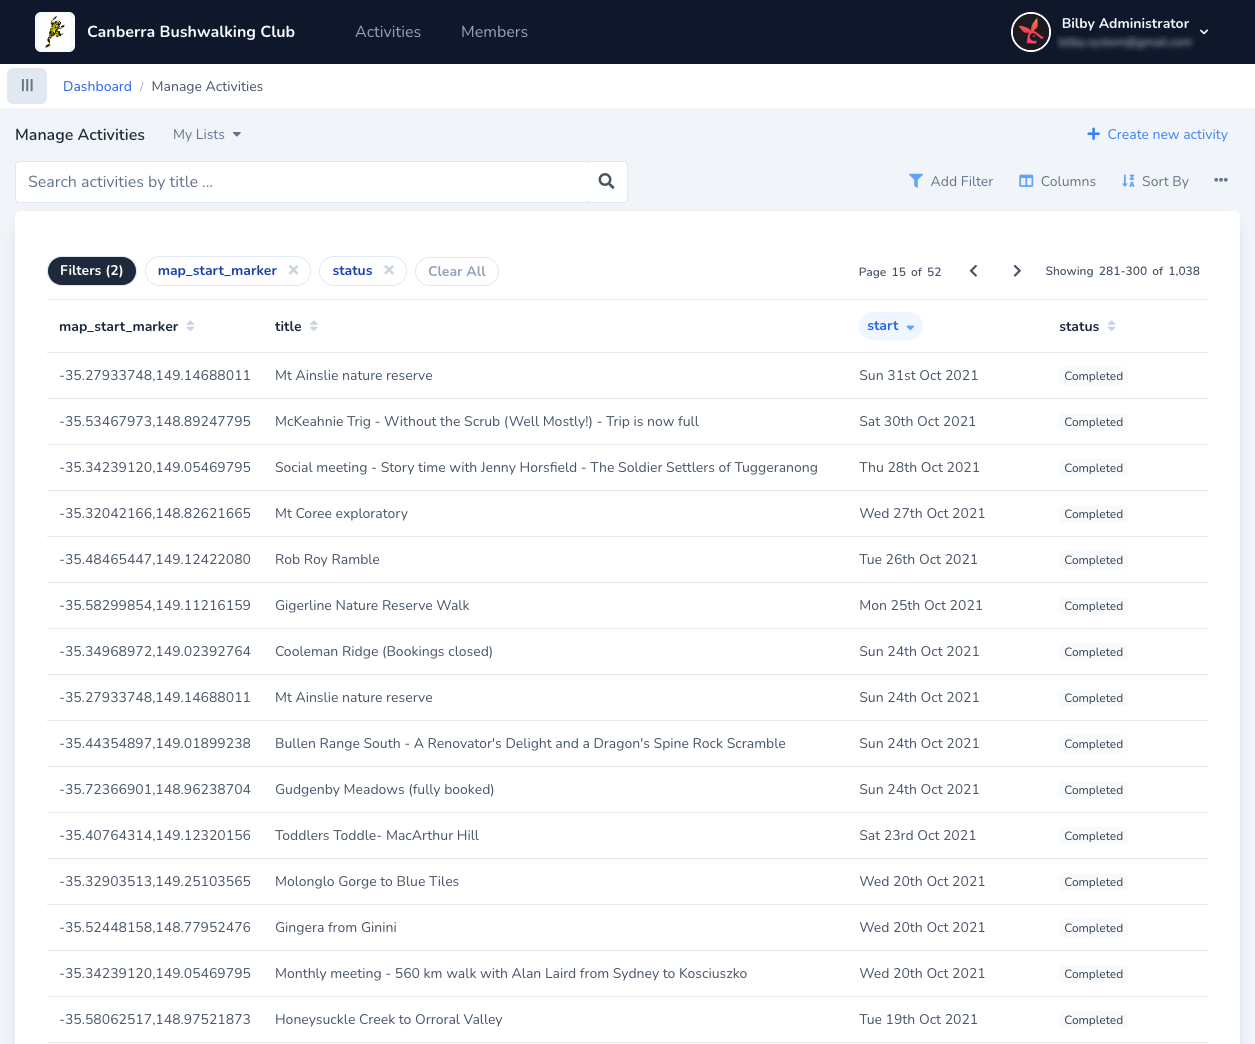
Activity management in Bilby Management Software.
Next to our filtering/sorting/columns buttons we have 3 little dots. These are the options for this reporting page. When we click on that button, we can see some options. Right now we are interesting in the Exporting to CSV option.
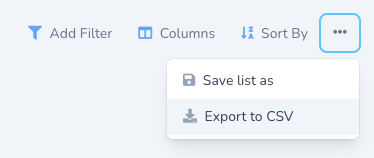
Options available for this report.
This gives us a clean CSV of all the data formatted in the same way as our report in Bilby!
Part 2 - Preparing the data
For this part of the case study, we will be using excel, but any tabular data program such as Numbers by Apple, or Spreadsheet by Google would do the same thing.
We know that, to import data into Google Earth we need a separated latitude and longitude. Bilby Version 13.1-beta does not have these fields as separated for now, but we will be doing some great upgrades to addresses and map fields to make this more accessible in a version coming up!
2.1 Splitting out Latitude and Longitude
Full data manipulation in excel is out of scope for this case study, so we will simply dot point how we split the data, but there are obviously many ways to do this.
- Open the report that was downloaded
- Insert a blank row directly to the right of the map_start_marker field
- Select the map_start_marker column
- Click on the Data tab in excel
- Select the Text to Columns option
- Follow the wizard and select the “comma” to separate option
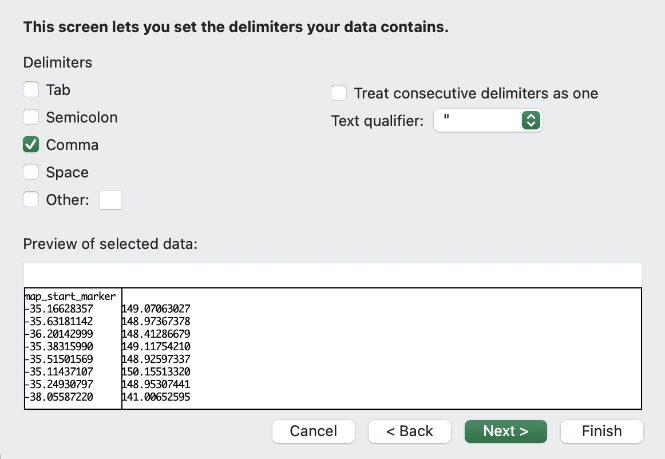
Splitting the activity marker by the comma in excel.
This step is essential to easily import the data into Google Earth. So, now we have the data split into 2 columns, we can give the a title “lat” and “long”, save the document and move onto the next step or perform further processing of the data.
We really wanted to see this data spread over year by year, so at this stage, we split the data into years but this can also be done in the filtering step.
Part 3 - Importing the data into Google Earth
Our skills in Google Earth are not great, but we will spare you the fumbling around that we encountered and try to get to the point. Just like in like part 2.1, we will only outline the basic steps to keep this in scope.
- Open Google Earth Pro (We used the desktop version)
- Select File > Import to open up the import wizard
- Select your exported data that we prepared earlier
- Select which fields contain lat/long
- Click on Finish to see the imported data
We did a small bit of playing around with the marker styles because for some reason we find it valuable to spend hours playing with visual configurations, but that could just be us. 🤷
We imported each of the split up data files into years so we could toggle the markers. This was very fun to play around with. We have grabbed a couple of screenshots to demonstrate the fruits of our labour.
3.1 Activity coverage over Australia
As you can see in the next figure, there are heavy clusters of markers in the Australian Capital Territory. This shows some very impressive coverage by Canberra Bushwalking Club. Also impressive, there are little markers scattered all over the Australia in different areas. We think some of these would be very difficult to trek. Scrolling around we can see there have been activities run all over the world.
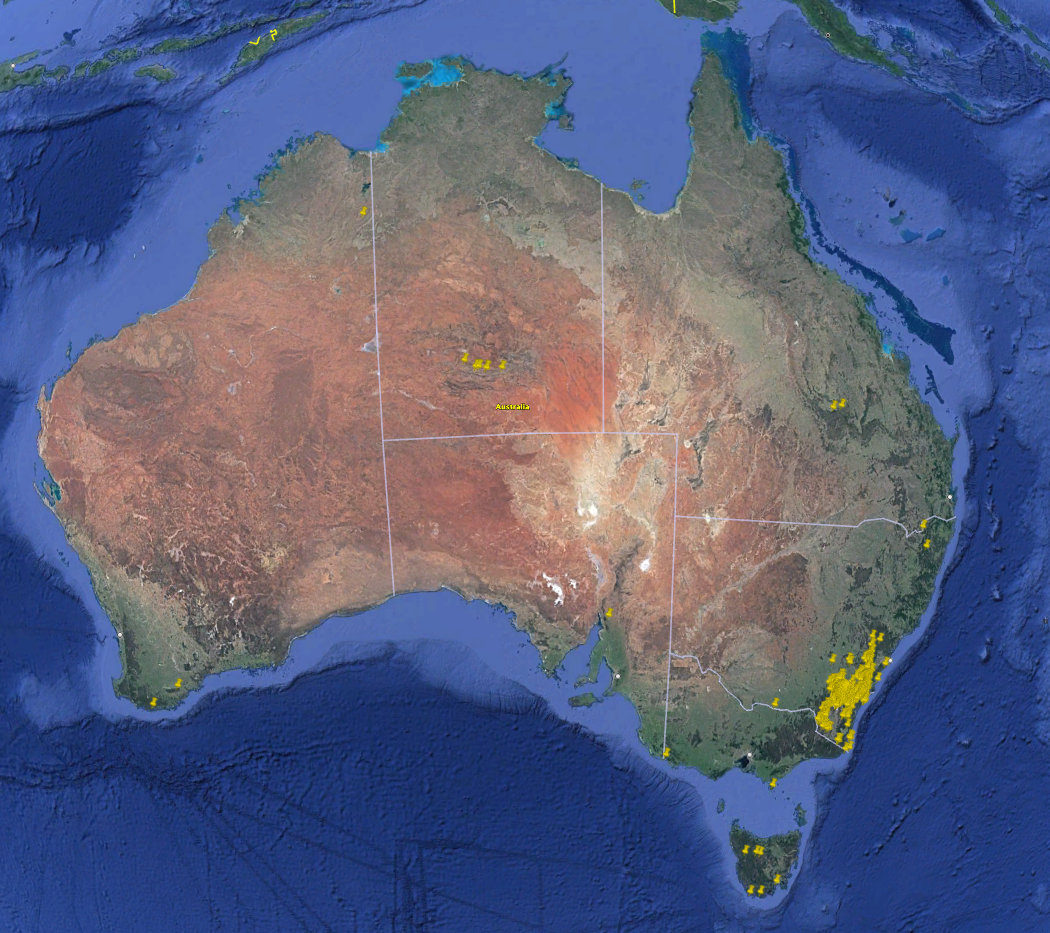
Yellow markers indicate an activity that was Completed by Canberra Bushwalking Club.
3.2 Activity coverage in ACT from 2017-2022
Here is the activity coverage in the ACT region from 2017 - 2022 with a couple of things to note. Data was imported from late 2017 hence the few pins, and we can see a reasonable drop on activities run around 2020 for obvious reasons. That being said, there is a huge amount of coverage from a small club like Canberra Bushwalking Club, and I think it’s fair to say they have thoroughly explored high and low throughout ACT.
Activities Completed by Canberra Bushwalking Club.
Wrap up
Well, we were successful with our initial goals, and we performed some decent testing of the new reporting features in Bilby. Playing around with reporting we can get some great insights and with a little manipulation of the data, we can see an interesting story appear.
We also have another case study looking at User Reporting that dives into exporting data into the third party application, Mailchimp. Feel free to check it out!